Asset health for power and energy
Know which transformer will need you next, and why.
Condition scoring for transformers and grid assets. Test results, online monitoring and inspections become one score per asset, with the reasons behind it and the action it calls for.
The problem
The data to rank your fleet already exists. It just has never been in one place.
Your oil tests sit in lab PDFs, your online monitors in SCADA, your inspection notes in spreadsheets. Each one tells you something, but nobody can line them up across the whole fleet. So maintenance follows age and habit, and the unit that is really deteriorating gets found when it trips.
What we do
What it does, working as one system.
-
Health index
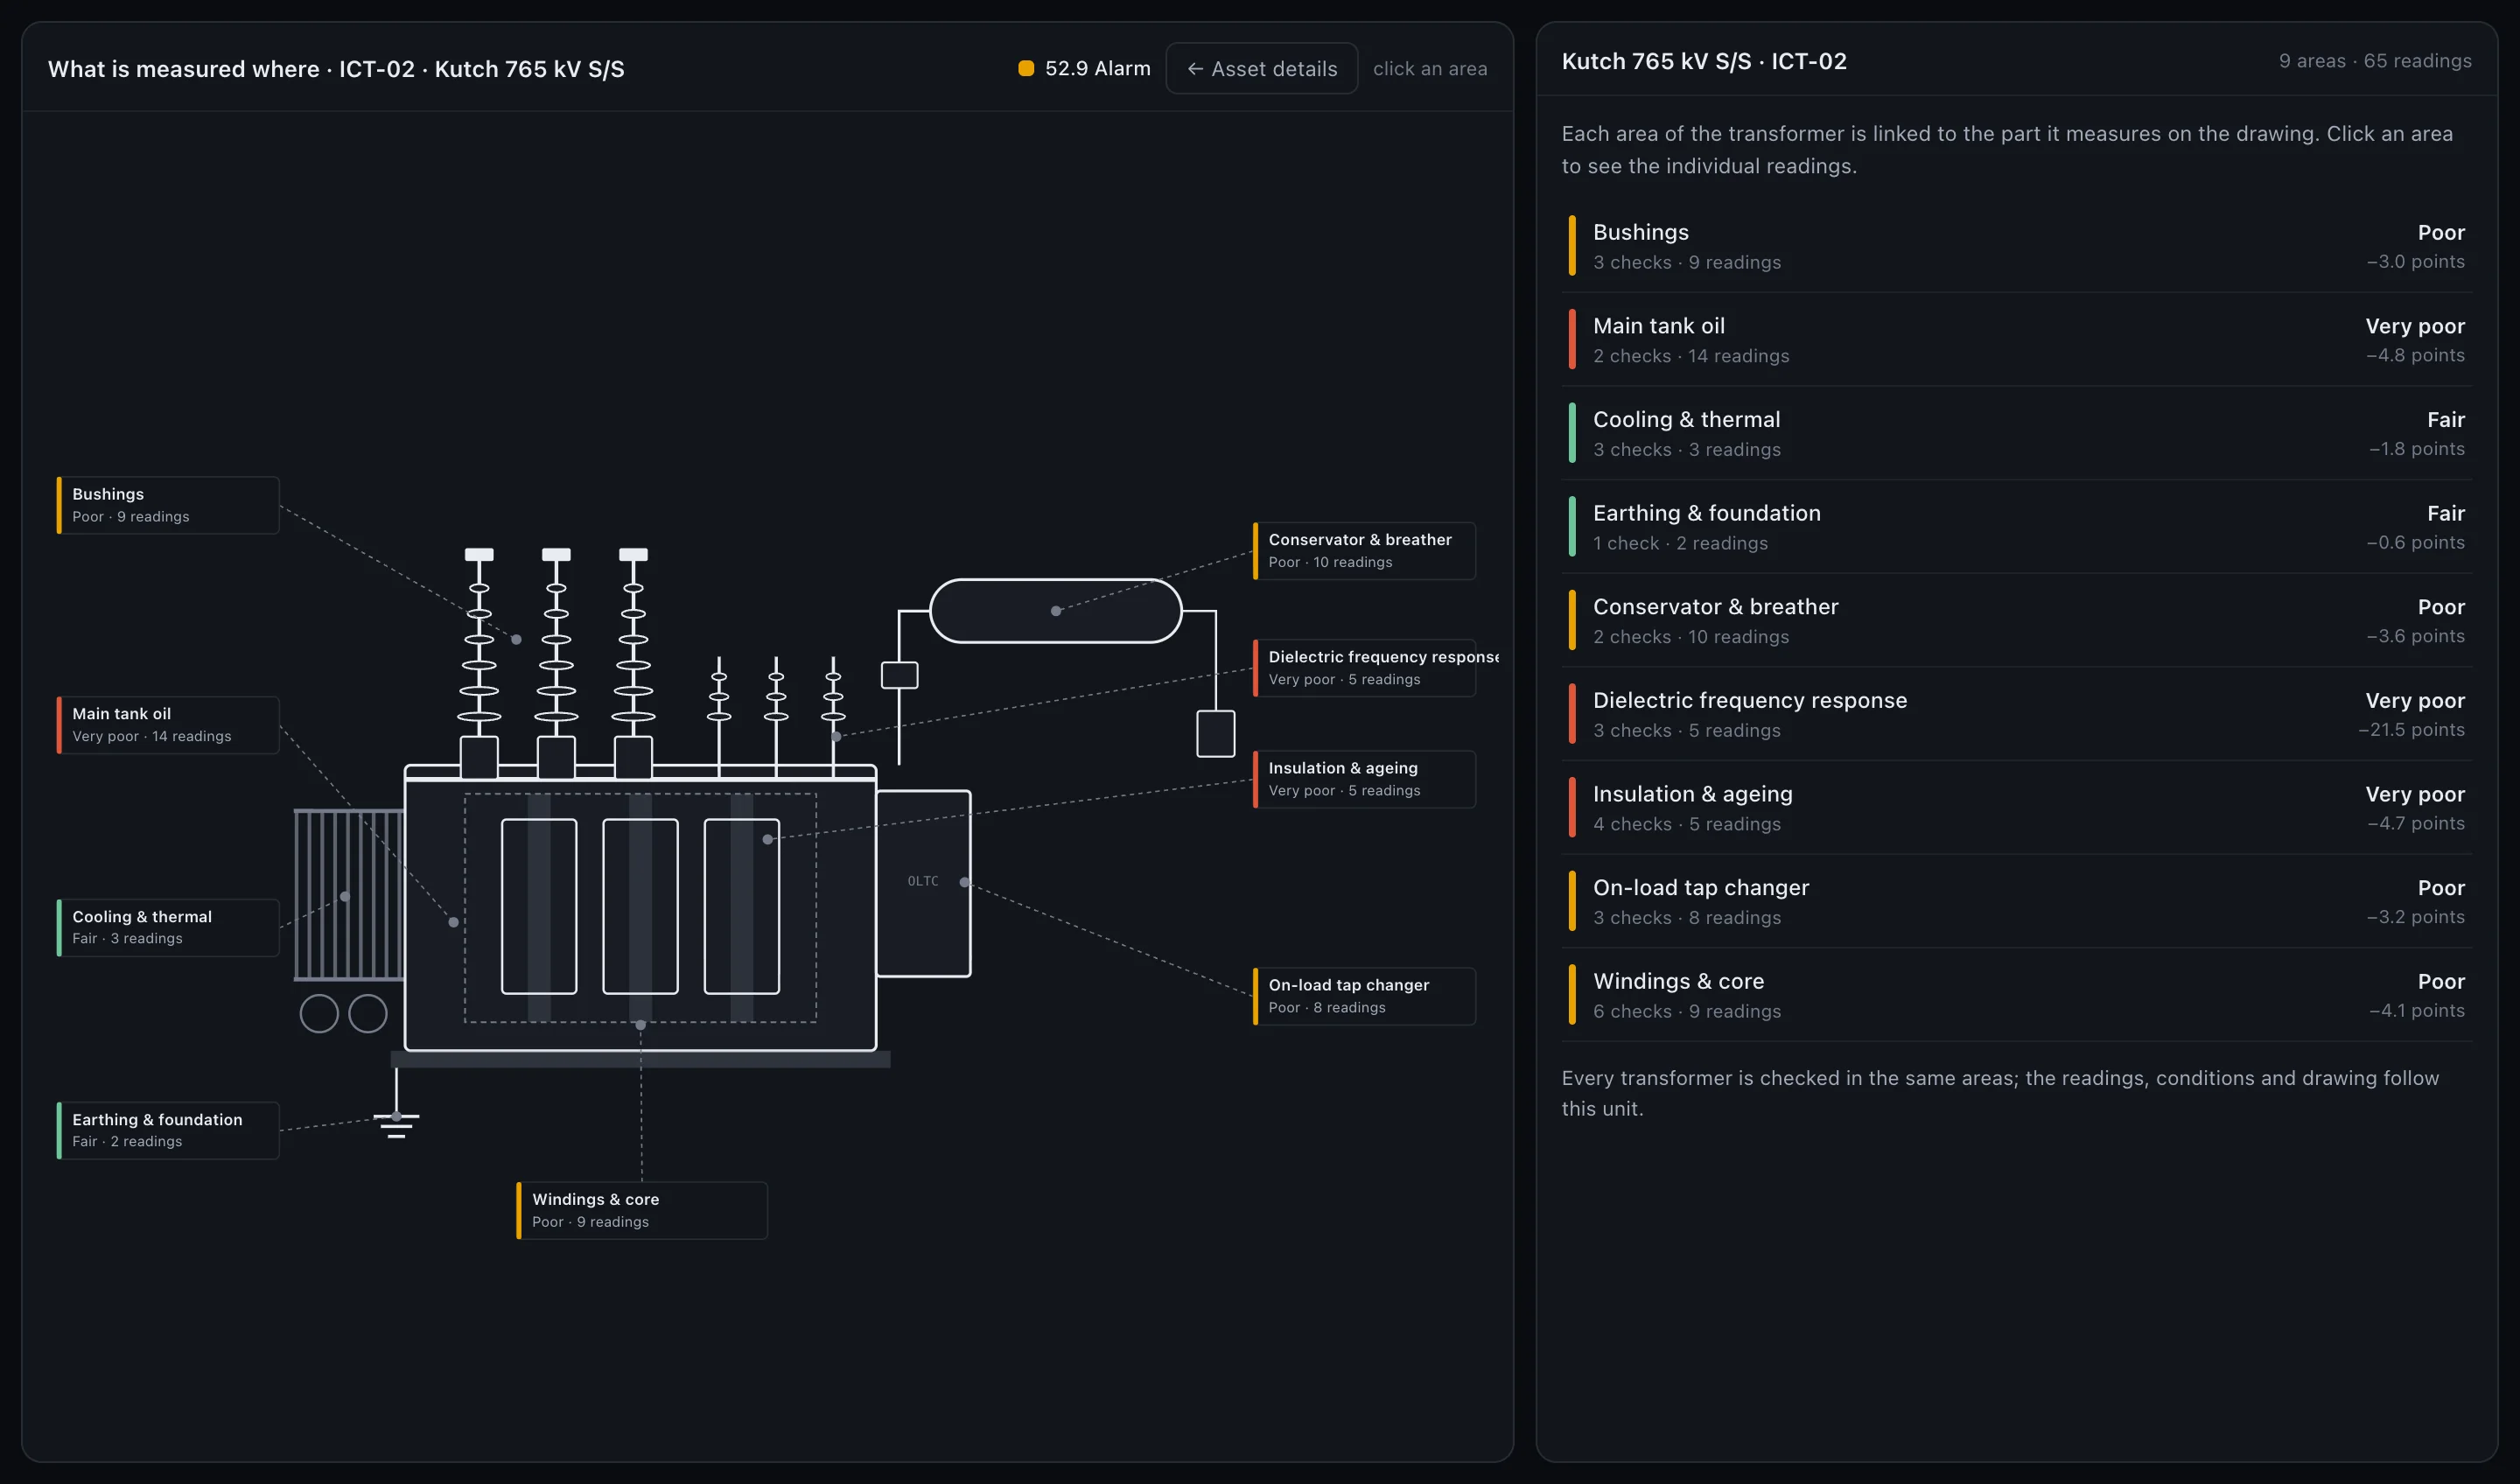
Every check becomes a condition score, rolled up by area into a 0 to 100 index per asset, with a band and the recommended action.
-
Diagnostics
Dissolved gas results read with recognised methods such as the Duval triangle and pentagon, alongside insulation, bushing and tap-changer trends.
-
Rules your engineers own
Weights, score tables and thresholds live in a readable ruleset. A change shows its effect on the fleet before it is published.
-
Worklist and reports
A ranked list of what needs attention, alarms when a reading moves the wrong way, and printable reports per asset and for the fleet.
How it works
From your data to a working system.
Map your data
We connect the sources you already have: lab results, online monitors, inspection records and work orders.
Agree the rules
Your engineers review the ruleset with us and tune weights and thresholds to your standards.
Score the fleet
Every asset gets an index, a band and a recommended action, with each score traceable to its readings.
Work the list
Planning, alarms and reports run from the same scores, so outage plans and budgets point at the same assets.
What changes
What you get from it.
- One ranked list for the whole fleet. Outage and replacement planning start from the same view.
- Every score explained. Engineers see exactly which readings cost points, not a black-box number.
- Late or missing data made visible. Each score shows how complete and how fresh its inputs are.
- A defensible plan. Reports that stand up in front of a board, a regulator or an insurer.
How we engage
Start small. Decide with evidence.
-
Prove it on your data
Score one substation group or one class of asset from your real records, and check the ranking against what your engineers already know.
Fixed scope · fixed price · agreed before work starts
-
Roll it out
If the pilot earns it, we build the full system, connect the rest of your data and bring your team onto it.
Only if the pilot earns it
-
Run it, or own it
We keep it running and improving, or hand it over with the code, the documentation and a runbook.
Your code · your data · your cloud account
Questions
What people ask before a first call.
Can we see it running?
Yes. We walk through the application on a call, on a transformer fleet, and show how your own data would map into it.
Does it cover assets other than transformers?
Everything asset-specific lives in a ruleset: the checks, weights, score tables and bands. Circuit breakers, cables or generator transformers are a new ruleset, not a rewrite.
What if our data is patchy?
The index uses the last result on file and shows how complete and fresh the data behind each score is, so a low-confidence score is never mistaken for a confident one.
Start with a conversation
Tell us what's slowing your operation down.
A 30-minute call with the people who would build it. You leave knowing whether a pilot makes sense, and what it would cover.